Future-proofing energy consumption
The U.S. energy infrastructure is large and plodding. Assets span coal mines, gas wells, oil refineries, hydro turbines, nuclear plants, generating stations, pipelines, power lines and technology—to name a few. Trillions of dollars over scores of generations have built a system that delivers a continuous stream of energy to the third-most populous country in the world—home to over 330 million people. And now we’re a net exporter.
Like the hard assets on apartment properties—equipment, appliances, even buildings—the nation’s energy-producing assets have calculated useful lives, too—many over a half-century. Slow asset turnover equates to the rate at which core systems can change.
The history of America’s energy production is plodding—but heretofore reliable and now officially resilient.
The nation has achieved energy independence, according to the Energy Information Administration (EIA). We’re now a net exporter of energy, building the economy and creating the operational resilience that we’ve dreamed of for decades.
How was this accomplished? American ingenuity. Total U.S. energy production supplied by fossil fuels over the last 50 years fell from 92 to 80 percent according to EIA. This includes petroleum, natural gas and coal. Eight percent is drawn from nuclear electric power. Renewables (geothermal, solar, hydroelectric, wind, biomass waste, biofuels, wood) generate the remaining 11 percent of the nation’s total energy output.
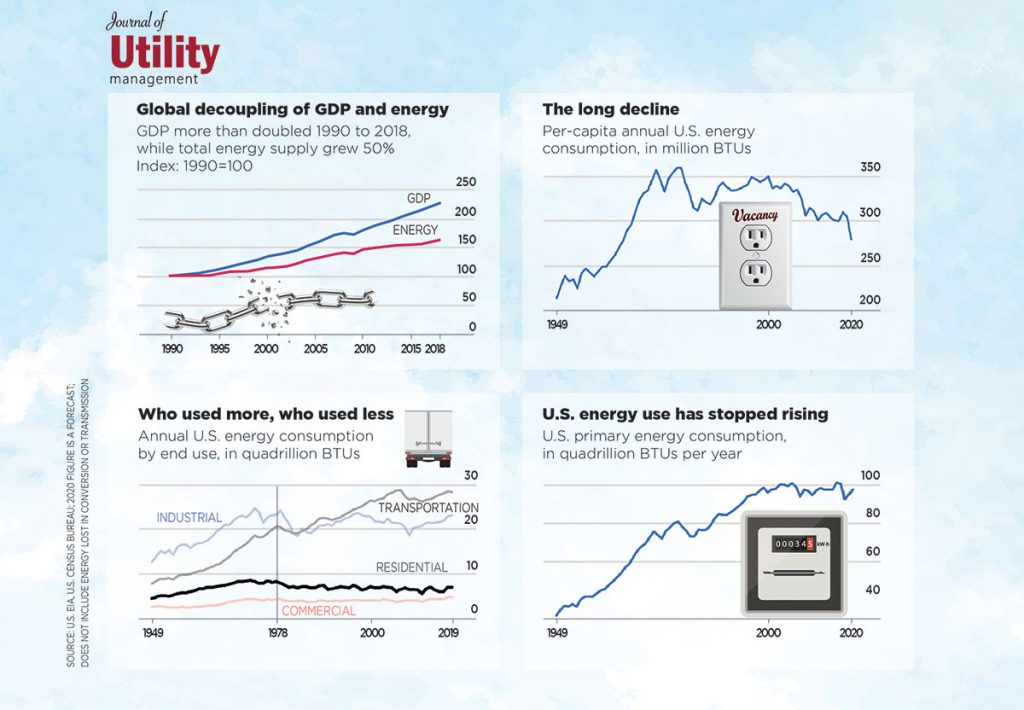
While both energy production and innovation have remained in high gear, consumption has dropped through better technology and conservation. This nexus has culminated in a downward trend in U.S. energy consumption per capita over the last decade—even as the population grows.
Price, tech inform free markets
Innovation and price will always guide free energy markets and set the focus for invention. Historically, government regulations and subsidies through tax credits, loan discounts, rebate programs and other artificial stimuli have moved the needle on things like nuclear and clean energy, but only marginally. Such programs are designed to change the payoff model for nascent technologies in order to nudge market adoption and elevate interest in innovation.
Until the payoff model catches up to business profitability, economics will always guide free market adoption. Still, as administrations change, so do their priorities and their interest in creating change.
The agility of a rental business is found in many data points. Dialing in to what that means in today’s business environment is part of navigating risk and finding points of profitability in all climates.
Remaining informed and current on subsidies and credits around energy-efficient products and services will be ever more imperative to navigating today’s operations and business environment.
American innovation: A history
U.S. energy production is plodding, but American ingenuity, bolstered by free markets, remains quick and nimble.
Until the 1970s, energy was cheap, abundant and run by the private sector. When cartels replaced free markets, the Feds stepped in to control runaway energy prices. This led to the formation of the Department of Energy (DOE) in 1977.
Through the years, DOE’s focus has expanded to include clean energy technologies, betting that such innovation will become the “cornerstone of prosperity.”
Still, price and technology have yet to meet at the point of market viability. Clean energy remains on the drawing board of feasibility and so is still highly subsidized. With government intervention, hybrid models do work as technology improves.
Flipping the business model
John S. Hoffman worked for EPA in the 1990s. A researcher, inventor and environmentalist, Hoffman was one of the first at EPA to study climate change and its potential.
Hoffman surmised that the fastest way to control the negative environmental impact of fossil fuel-based energy was to reduce consumption. Hoffman calculated that this could be accomplished by eliminating wasted energy consumption through awareness and better performing appliances and equipment.
ENERGY STAR was born. Fast-forward and by 2018, over 800,000 ENERGY STAR products spanning electronics, appliances, equipment and lighting were sold annually, according to EPA. The brand has since expanded beyond residential into commercial and industrial operations, saving an estimated $35 billion in energy in 2018.
Still the second-largest energy consumer in the world, the U.S. reduced electricity consumption again in 2019, according to Statista. Such decline is even a greater feat as the nation’s population continues to grow.
Next pivot in U.S. energy
Reducing energy consumption continues to garner traction around the world because of its economic and environmental gains.
In 2012, EPA’s ENERGY STAR Portfolio Manager moved the model to America’s buildings—including residential apartments. Working from the same voluntary-based program as ENERGY STAR, property owners could register their buildings online in order to benchmark performance against other similar buildings nearby.
Portfolio Manager enables property operators to record, track and benchmark building performance anonymously, effectively calculating property improvements for profitability, as well as positioning a property for available green lending and other subsidies.
Recently, local governments—such as New York City—have made programs like Portfolio Manager mandatory.
Beginning October 2020, NYC buildings 25,000 sq. ft. and larger must have a building energy assessment and post the resulting grade in public view. Buildings are graded A to F according to their ENERGY STAR Score.
Nearly half of NYC’s 40,000 buildings posted grades of D or lower (Fs are only given to non-filing buildings). Grading occurs once annually.
In 2024 the city will fine buildings in what could run into the hundreds of thousands for failure or for low energy performance.
The mandate is part of NYC’s plan to reduce emissions by 80 percent by 2050. Studies found that buildings put out nearly 70 percent of NYC’s carbon emissions related to energy consumption.
The NYC ruling is meant to compel property owners toward energy efficiency through public pressure and regulation. This moves away from the ENERGY STAR model that relies on free market and internal fiscal analysis to determine when to pull the lever on upgrades. Historically, regulating behavior has only slowed economies and advancement, such as housing construction.
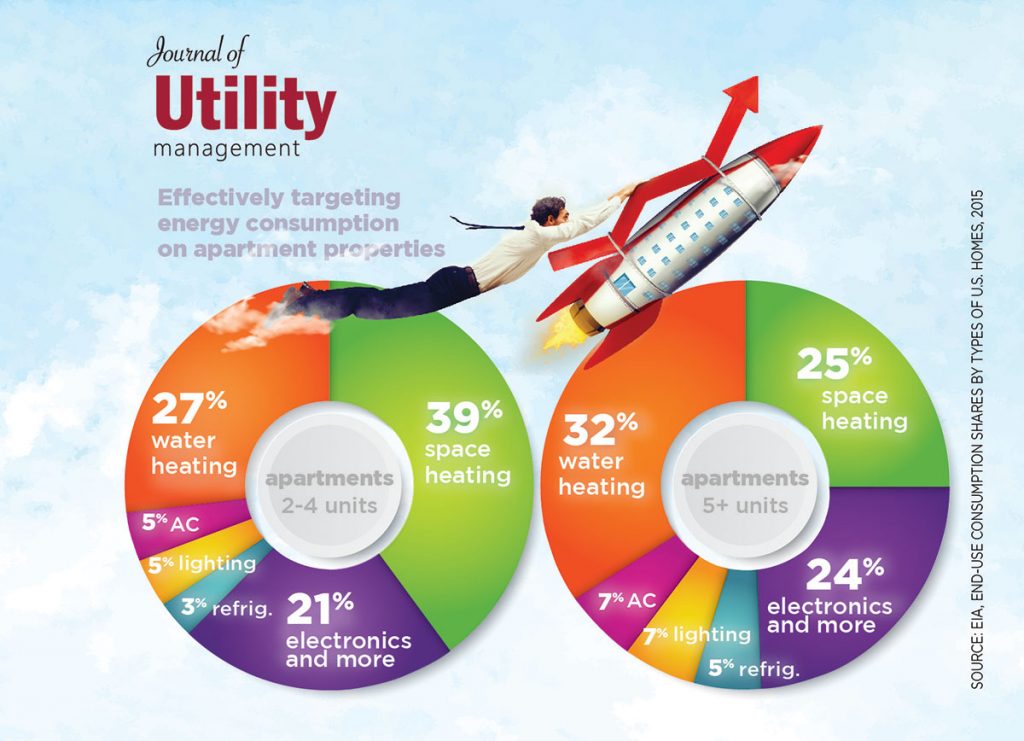
Plus, upgrading appliances and equipment only get a property owner so far. Residents control up to 80 percent of energy use, according to the U.S. Department of Energy. What this means is that engaging residents “in energy efficiency is crucial to unlocking the full energy-saving potential of a building.”
Payoff analysis
Technology changes everything, and the speed of technological advancement is increasing. Seemingly overnight, LED light bulbs shifted the lighting market. Smart thermostats changed one of the largest costs of building operations and on-demand water heaters are heading in a similar direction with on-demand water heating.
We cannot know what advancements are possible without first measuring consumption, and then analyzing it against our properties’ performance.
The technology and innovation around property data has also advanced since the first days of Portfolio Manager, along with the usefulness of the data.
Understanding where a property is among its competitors is a baseline to market performance. In the coming days, it will also be pivotal to simple operational and performance resiliency.
Historical perspective
- March 2024
- February 2023
- July 2022
- March 2022
- June 2021
- February 2021
- August 2020
- February 2020
- July 2019
- April 2019
- June 2018
- April 2018
- October 2017
- May 2017
- November 2016
- June 2016
- November 2015
- June 2015
- September 2014
- June 2014
- April 2014
- December 2013
- July 2013
- December 2012
- July 2012
- October 2011


