With increasing frequency, the term net zero is entering conversations around the design and operation of the built environment. This is an important goal, but what if what we are designing and calling net zero will not be net zero for decades?
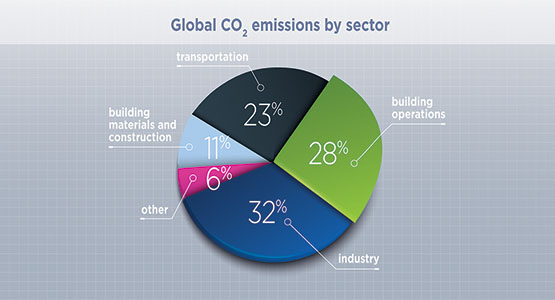
The impact of the built environment is well documented and accounts for 39 percent of annual global greenhouse gas emissions. Looking deeper at that 39 percent we find that 28 percent is from building operations while the remaining 11 percent is from building materials and construction, according to the Global Alliance for Buildings and Construction 2018 Global Status Report.
That 11 percent is the focus of the conversation around embodied carbon and is also the reason why that net zero building may not really be net zero for decades, despite being designed to operate at zero emissions. In fact, fundamental to actually designing a net zero building is to understand the materials being specified and their impact.
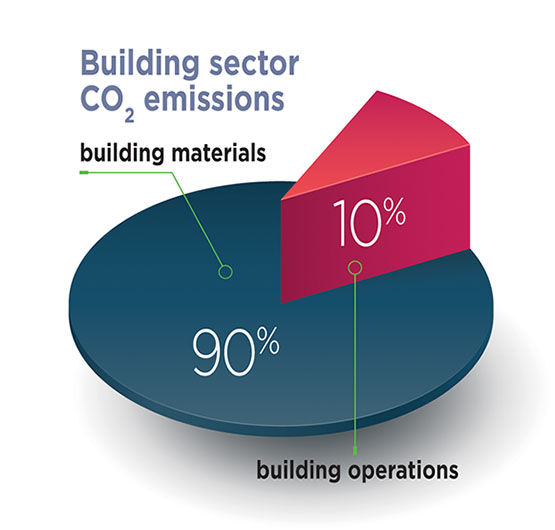
This is particularly important in new construction, as 90 percent of the carbon released from buildings constructed between 2015 and 2050 represent embodied carbon associated with building materials, according to Architecture 2030.
Just as in energy management, the foundation is data and understanding the level of carbon intensity of the products specified. Once we understand which materials contribute the most to a building’s embodied greenhouse gases, we can begin to evaluate those materials to determine if less carbon intense materials are available.
There are free databases, which can be a good starting point. One such database is the ICE Database at Circular Ecology and the Quartz Database, as well as the recently released EC3 Carbon Calculator Tool. These resources provide a better understanding the amount of carbon in materials.
Another tool is the Environmental Product Declaration (EPDs), which provides a product-specific look into the impact of the materials in a product. The EPD contains life cycle assessment information summarized into an easy to read format. The format also lends itself to allow for comparisons between products. The EPD is a valuable tool in comparing like products against like products.
The gold standard in understanding the Embodied Carbon in a project is to conduct a whole building life cycle assessment. From cradle to grave, this assessment examines the impact over the entire life cycle of the project.
The drawback of this approach, however, is cost, as not every project has the budget for a full-scale, whole-building life cycle assessment. But there is a valuable takeaway from whole-building life cycle assessment, which is the realization that structural systems almost always comprise the largest source of embodied carbon in a project, up to 80 percent. This means that targeting the structural system and material choices in the concrete, steel and wood can make a major impact on the overall embodied carbon in a project.
Take concrete. Concrete is one of the biggest carbon emissions culprits with a significant presence in nearly every structural system. While largely rock, sand and water, about 11 percent of the typical concrete mix includes portland cement, a substance that, alone, is estimated to be responsible for 5 percent of total global carbon emissions.
Made of calcium carbonate, silicon, aluminum, and iron, about 1.6 tons of raw materials are required to make 1 ton of cement. The elements are placed in a rotary kiln and heated to about 2,700 degrees Fahrenheit, largely through the burning of fossil fuels. Yet, the inclusion of fly-ash or blast-furnace sludge can reduce the embodied carbon in the concrete mixes.
From structural elements to interior design components, taking the extra step to investigate what is in the materials you specify, then investigating whether alternative, less intense options are available, can make a big difference in the embodied carbon in your project. Only when we consider the full impact of our design can we truly design and deliver a net zero building.
Chris Laughman is Director of Sustainability for Greystar.


Your point of view caught my eye and was very interesting. Thanks. I have a question for you.
Thank you for your sharing. I am worried that I lack creative ideas. It is your article that makes me full of hope. Thank you. But, I have a question, can you help me?
Your point of view caught my eye and was very interesting. Thanks. I have a question for you.
I don’t think the title of your article matches the content lol. Just kidding, mainly because I had some doubts after reading the article.