 As utility costs continue to rise—driven largely by water and sewer—owners and managers scramble for alternatives to lower the net utility costs for their portfolios.
The focus has shifted from increasing the pass-through portion charged to the residents to, now, eyeing underlying costs. Resident charge-backs are quickly approaching their maximum limit, either legally or due to market conditions. Owners are pressed by residents to address their side of the equation, and are compelled to do all they can to lower the underlying costs incurred inside and outside the apartment.
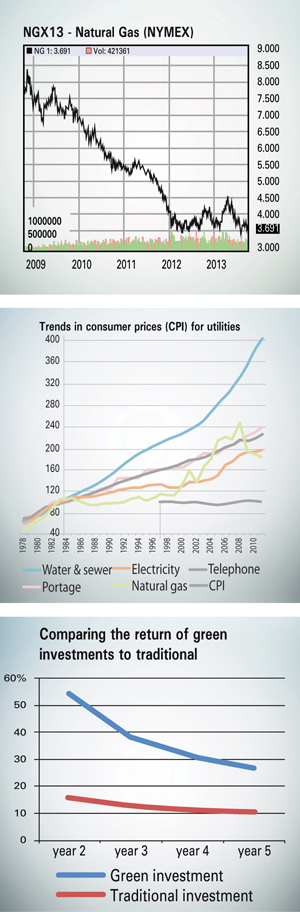
With natural gas prices still near historic lows (figure 1), most owners have already taken advantage of the drop (even if by accident) and now work to hedge pricing as the rebound undoubtedly nears. But water costs continue to rise (figure 2) faster than any other utility and the overall Consumer Price Index (CPI). With aging water and sewer infrastructure across the country, these increases are nowhere close to done.
Owners are being forced to focus on consumption to further mitigate increasing costs. But before you launch into the latest technology and retrofits—or worse yet—decline the project because you don’t see value or pay-back, there are factors to consider when evaluating the go/no-go decision, and to ensure you optimize any return on utility retrofit projects.
Spend the time on the due diligence underwriting the project. In today’s market, underwriting a potential acquisition or development project involves looking at market conditions for potential increases in rent and occupancy, outlook for job growth, overall economic indicators, etc.
But often times when evaluating a utility retrofit project, owners simply look at cost and return based on today’s dollars. Few project expected increases in utility costs, its impact on resident retention and the useful lives of the assets.
Beyond that, owners are held back by extended pay-back periods (i.e. in excess of 5 years) even though the true return on a retrofit is significantly higher than merely the NOI and cash flow return on the underlying real estate asset—and would be accretive to the overall results.
For example, owners and investors look at a typical transaction of flipping an asset at a lower cap rate than originally purchased and the income made on that value creation. This often results in an internal rate of return (IRR) approaching 20 percent.
Owners, however, often overlook a utility-focused retrofit or investments that might yield an IRR of 40 percent in the same time period. Granted, there are several factors in this calculation (leverage, net utility costs after resident rebilling, etc.), but the results still justify project inclusion.
To optimize the return of their capital investment dollars, owners should consider the benefits of the increased NOI from utility retrofits and not just cosmetic changes, such as new kitchens and baths, which may take longer to recognize added value. In a simple comparison of an asset that is purchased at a 7.5 percent cap and sold at a 6 percent cap versus a utility investment with a pay-back of nearly 7 years, the IRRs are drastically different.
When optimizing the return of any utility efficiency project, owners and managers cannot simply complete the retrofit and move on. Most consumption-targeted projects require review to keep results in line with expectations. Maintenance programs must be followed, and available resources should be used to their full potential, to set goals and monitor the performance.
Simple procedures like monitoring irrigation settings help mitigate any change by landscapers or on-site teams overriding the system and missing out on potential benefits. With the latest tools, owners and managers should budget for expected results. Utilities can be budgeted at both the consumption and rate level—not just cost.
Such visibility allows stakeholders to quickly ascertain the reasons for any variances from expectations. All too often, the true cause of a variance (or true benefit) is hidden in net cost, which leads to distrust in the project and future benefits.
For example, an increase in utility costs of 5 percent after a significant retrofit could sour investors and owners to future utility projects. However, if this 5 percent increase is due to rate increase of 20 percent and a consumption decrease of 15 percent, the reality may be that the project is, in fact, delivering the results expected, and boosting the bottom line significantly.
The underwriting, management and measurement process for optimizing utility retrofits is no easy task. The variables involved continue to complicate the analysis (whether it’s turnover in on-site teams, vendor changes, or simply not enough time to focus on the programs).
When the available technology, tools and resources are combined with the discipline to execute, retrofit projects can in fact lead to great returns across the portfolio.
Author Tim Rogers is vice president with SmartSource by NWP.


Thanks for sharing. I read many of your blog posts, cool, your blog is very good.
Can you be more specific about the content of your article? After reading it, I still have some doubts. Hope you can help me.
Your article helped me a lot, is there any more related content? Thanks!