“Budget season is almost here. I’m so excited!” says Mary Nitschke, director of ancillary services for Prometheus and president of the Utility Management Advisory. Not many share her enthusiasm. Budgeting for utilities is more complex than most budget exercises because of the large number of moving parts.
Three of the largest variables are rate changes, usage changes due to weather, and usage changes due to operating and asset conditions. Utility budgets can be built by adjusting your prior year numbers using the forecasted rate changes (assuming a flat consumption) or by using the forecasted rate changes plus any additional consumption change. The latter is obviously more time consuming.
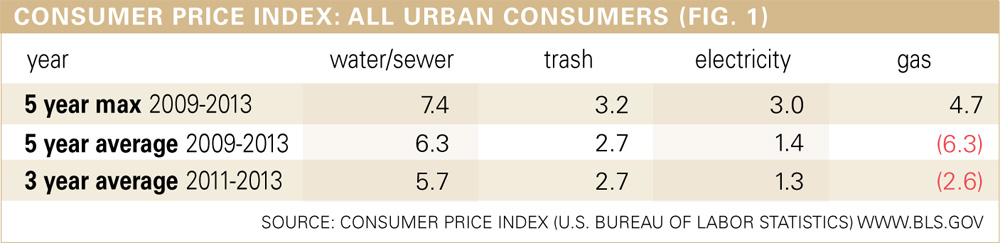
If you think “it’s a budget, not a Bible,” then check out fig. 1 for average national rate changes.
If you like to get in the weeds then roll up your sleeves and check your local utility’s website or give them a call for more detailed information into rate changes by utility provider. Often rate increases must be approved by a public utility commission and published in advance, although not always with much notice. Even then, you could invest a lot of effort and still end up surprised by rate increases next spring or summer.
As for determining the impact of operating and asset changes, you’ll need to research that on a property-by-property basis to determine things like occupancy rates, policy changes, and capital improvement projects that are expected to impact usage. You should note any anomalies that may have occurred in the prior year.
Budgeting for rate increases
Fig. 1 includes the average U.S. price increases for the different types of utilities. Some like to use the first row because it is a likely the worst case scenario, showing the highest annual increase in the last 5 years (2009-2013). In the case of water and sewer for example, while the average annual increase over the last 5 years was 6.3 percent, the highest increase over the same period was 7.4 percent. In addition to the more conservative worst case approach, there are optional 5- and 3-year increases shown which could be used instead.
Note that the natural gas changes are not a typo—it truly has experienced a decrease on average over the last 3 and 5 years. However, that is not expected to continue due to a number of macroeconomic factors. Also note, fig. 1 shows historical performance. As they say on Wall Street, past performance is not necessarily indicative of future results. That said, in the case of water, sewer and trash, this is probably a good gauge for setting future expectations.
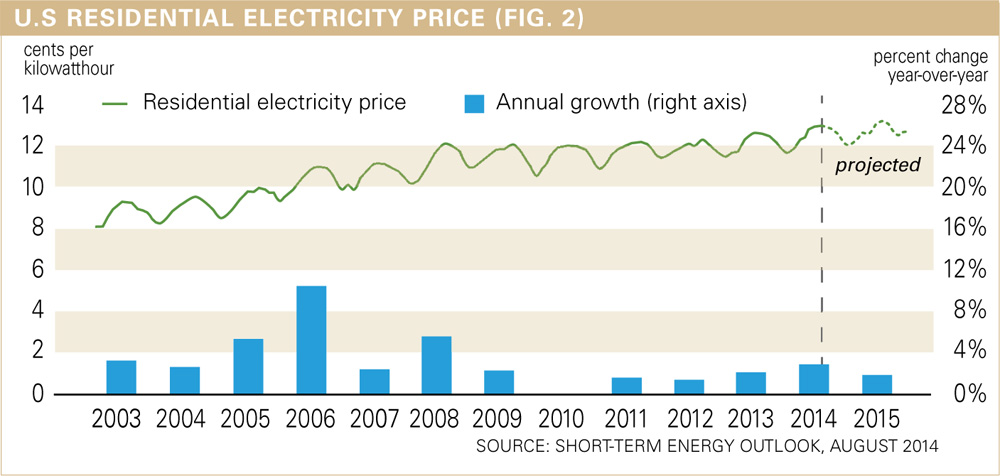
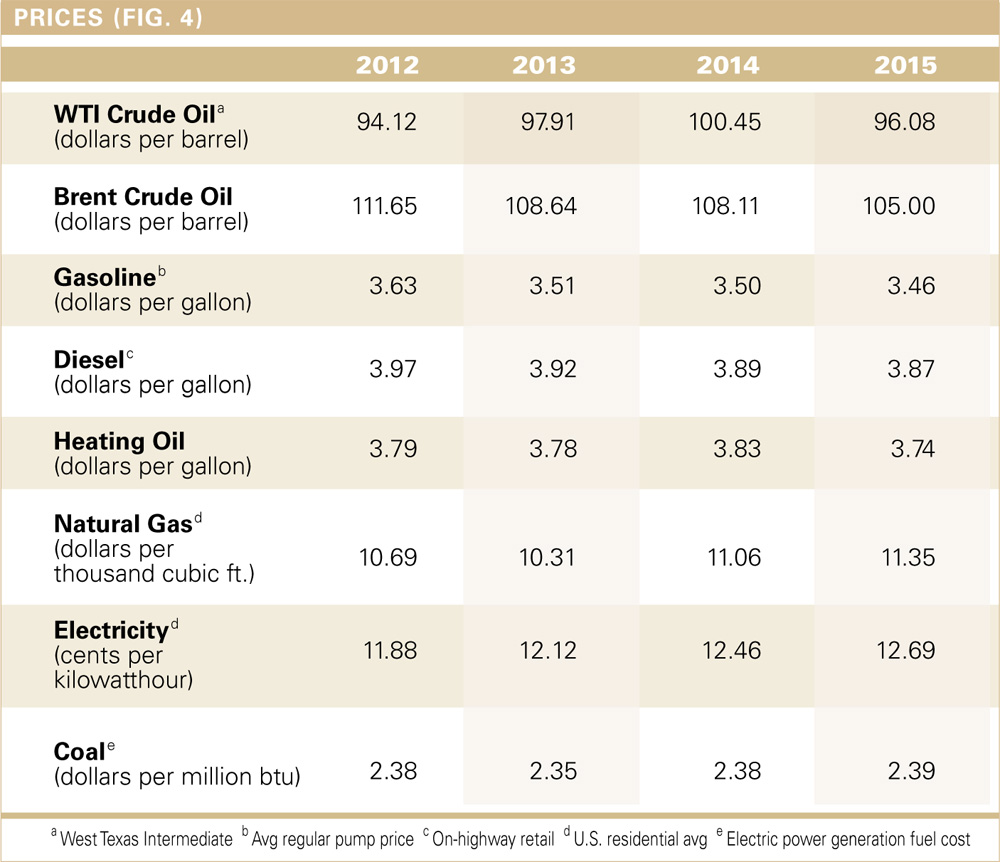
Since energy (electricity and natural gas) tend to be more volatile, most property and asset managers ignore historical averages and instead use the U.S. Energy Information Administration (EIA’s) forecasts for retail price increases for 2015. Currently, those numbers (fig. 2, 3, 4) are:
- Electricity 1.8 percent increase
- Natural gas 2.6 percent increase
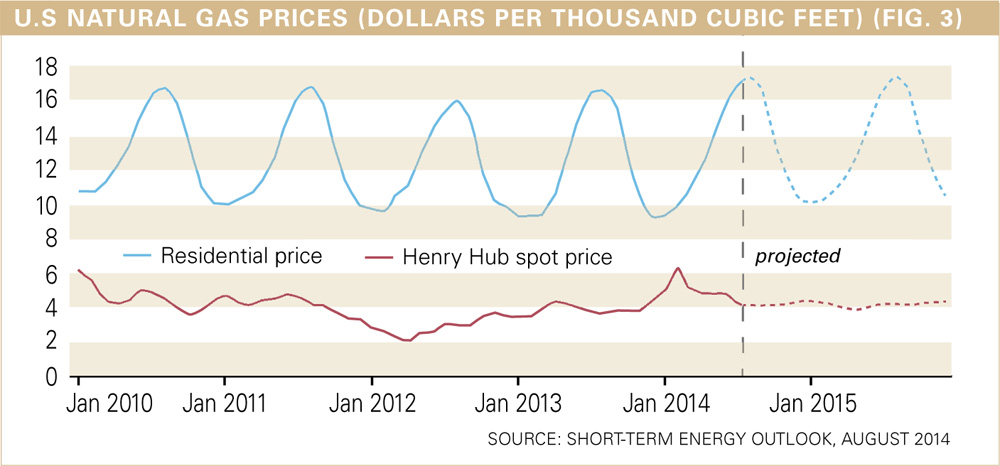
Natural gas price outlook
The EIA expects spot prices to remain below $4/MMBtu through October, before rising with winter heating demand. Projected Henry Hub natural gas prices average $4.46/MMBtu in 2014 and $4.00/MMBtu in 2015. Natural gas futures prices for November 2014 delivery (for the five-day period ending August 7) averaged $3.96/MMBtu. Current options and futures prices imply that market participants place the lower and upper bounds for the 95 percent confidence interval for November 2014 contracts at $3.03/MMBtu and $5.16/MMBtu, respectively.
At this time last year, the natural gas futures contracted for November 2013 averaged $3.58/MMBtu and the corresponding lower and upper limits of the 95 percent confidence interval were $2.68/MMBtu and $4.79/MMBtu.”
Electricity price outlook
The EIA expects the U.S. residential electricity price to average 12.5 cents per kilowatt hour during 2014, an increase of 2.8 percent from last year. Electricity prices increase throughout the country except for the Pacific states, where prices in 2014 are expected to average 2.7 percent lower than last year. Residential customers in New England experience the highest average price increase (8.5 percent).
The EIA is expected to release updated numbers about once a month. These numbers were released on August 12, 2014. If you can wait to finalize your budget until the next update, it might make sense to use their current numbers as a placeholder and refresh your budget when the new numbers are published on or around September 9 and October 7. Their reports are available online at www.eia.gov/forecasts/steo/.
Weather considerations
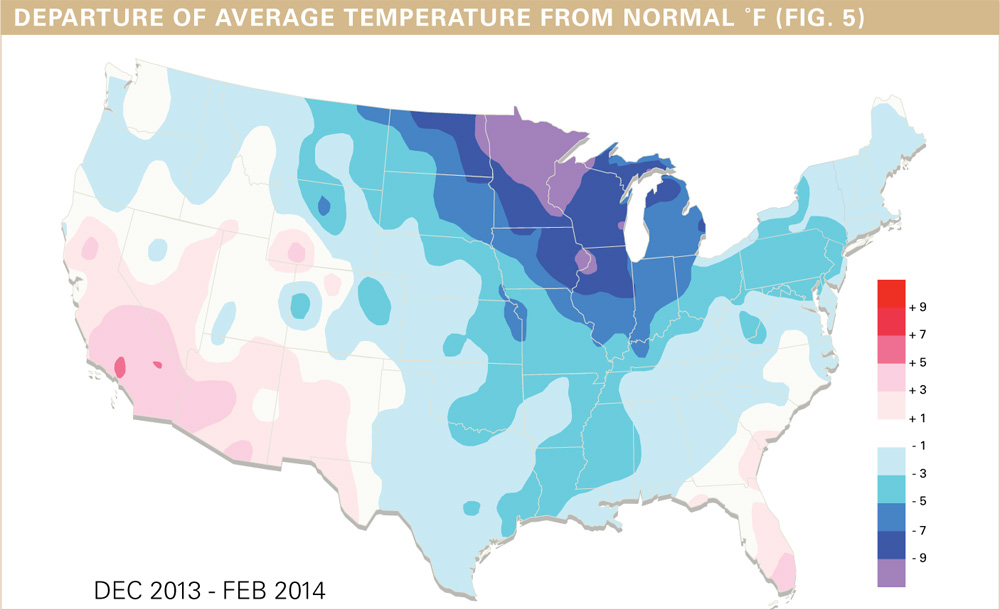
While it is difficult to predict the exact impact that any change in weather will have on usage, temperature and general weather conditions should be considered during your budgeting process. The National Oceanic and Atmospheric Admin. (noaa.gov) publishes average temperature information that can be used as a reference when reviewing weather conditions. As an example, fig. 5 shows last winter’s average temperatures compared to normal (30-year average). Generally the peak winter weather months are December, January, and February while the summer months are June, July, and August. On the weather map, blue indicates cold, and red indicates not cold or unseasonably warm. If using last year’s actuals for your baseline, you may choose to make adjustments to accommodate for any significant weather anomalies from the prior year.


Thank you for your sharing. I am worried that I lack creative ideas. It is your article that makes me full of hope. Thank you. But, I have a question, can you help me?
Your point of view caught my eye and was very interesting. Thanks. I have a question for you.
I don’t think the title of your article matches the content lol. Just kidding, mainly because I had some doubts after reading the article.
Your point of view caught my eye and was very interesting. Thanks. I have a question for you.
Your point of view caught my eye and was very interesting. Thanks. I have a question for you.